I conducted a 30-team sim tournament in NBA 2K22, partly to examine which team would win, but mainly to explore the statistical proclivities of this hoops simulator.
The 2021 NBA preseason is in the books, and the games start counting for real on Tuesday. I wanted to take this time where teams are feeling out what rosters and rotations work for them to examine what I’m working with when I use NBA 2K22 for simulation purposes.
I’ve been deep in the sports simulation game for most of my life, and I have done so in an unintentionally private manner. For years I have tirelessly worked on projects where the aim was to make things as “realistic” as possible. It was a nebulous level of perfection I was reaching for but could never truly attain.
As the NBA 2K22 cycle began, I once again started toiling on another fruitless project. That’s when I realized that I had been seeking out the “most realistic” simulation for so long that I had lost sight of what the foundation of the 2K engine even was at this point. The NBA 2K series has evolved over the years, so a lot of my knowledge and views of the attributes and tendencies could be based on old information.
It was time to go back to basics! I decided to do so with a single-elimination tournament involving every team in the NBA.
The Setup
All 30 NBA teams participated in this tournament. However, instead of seeding teams by record, I did so by end-of-season finish. For instance, the defending champion Milwaukee Bucks were the No. 1 seed, while the runner-up Phoenix Suns were the second seed. The Los Angeles Clippers and Atlanta Hawks, the two teams they defeated in the conference finals, were seeded third and fourth. This pattern continues for all playoff teams.
Seeding for these teams is mainly ordered by how many games they won in their final round. If multiple teams lost by the same amount of games, series point differential was the next determinant. Lottery team seeding was determined by regular season record, with head-to-head record as a tiebreaker if necessary.
The top eight teams (read: the conference semifinalists) received double-byes. The remaining playoff teams as well as the two teams that won the 9/10 play-in games received single byes. The last 12 teams had to fight their way into the main bracket.
The final seeding was as follows:
| Received Double-Bye | Begin in Play-In Round 2 | Begin in Play-In Round 1 |
| 1. Milwaukee Bucks | 9. Dallas Mavericks | 19. San Antonio Spurs |
| 2. Phoenix Suns | 10. Portland Trail Blazers | 20. Charlotte Hornets |
| 3. Los Angeles Clippers | 11. Los Angeles Lakers | 21. Chicago Bulls |
| 4. Atlanta Hawks | 12. New York Knicks | 22. New Orleans Pelicans |
| 5. Philadelphia 76ers | 13. Memphis Grizzlies | 23. Sacramento Kings |
| 6. Brooklyn Nets | 14. Boston Celtics | 24. Toronto Raptors |
| 7. Utah Jazz | 15. Washington Wizards | 25. Minnesota Timberwolves |
| 8. Denver Nuggets | 16. Miami Heat | 26. Cleveland Cavaliers |
| 17. Golden State Warriors | 27. Oklahoma City Thunder | |
| 18. Indiana Pacers | 28. Orlando Magic | |
| 29. Detroit Pistons | ||
| 30. Houston Rockets |
In terms of actually gameplay, I left the game on All-Star difficulty with almost every slider set to 50. The exceptions were 3-point success (60), steals (75), and blocks (25). I truly want to get a foundational understanding of what the 2K22 game engine is, but it was abundantly clear to me in my initial sims that there is an excessive amount of blocks and a tragically low 3-point percentage when those sliders are left at 50. I just couldn’t fold on that. The increase in steals was done to counteract the impending lack of rejections.
Three of the four movement sliders were set to a Min-Max range of 65 to 99. The exception is the Speed with Ball slider, with its Min-Max range of 60 to 99.
The Results
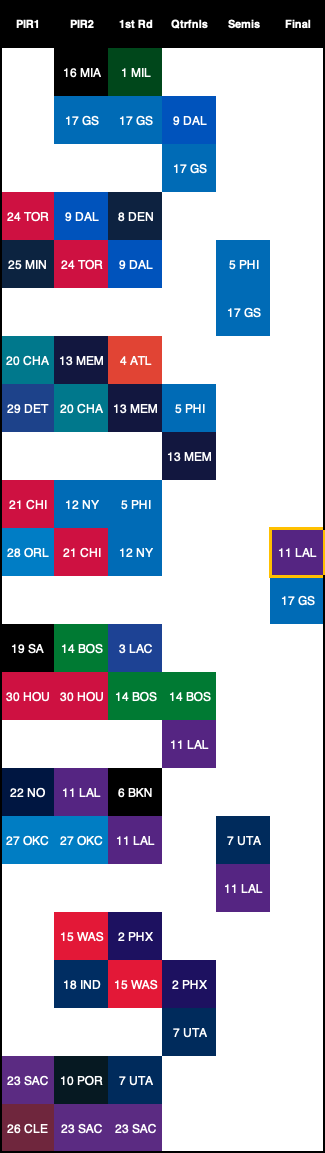
In the end, the No. 11 Los Angeles Lakers prevailed over the No. 17 Golden State Warriors, 103-95, in the Final.
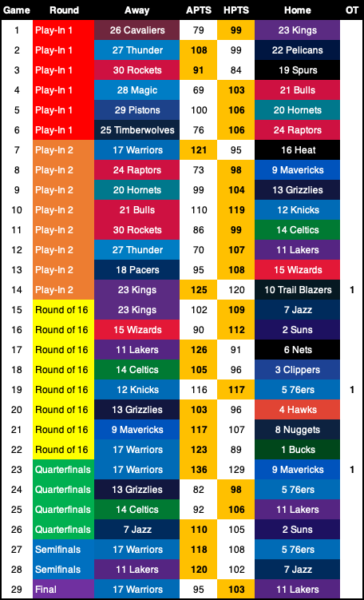
Here are the full results of the tournament in a colorful chart:
Or, if you prefer a colorful bracket:
13 of the 29 tournament games were decided by single digits. Five were determined by more than 30 points. The Lakers’ 37-point win over the Oklahoma City Thunder in Play-In Round 2 was the largest margin of victory in this tourney.
Golden State’s 136 points in their quarterfinal overtime win over the Dallas Mavericks were the most scored in the tournament. The Lakers’ 126 points in their Round of 16 win over the Brooklyn Nets were the most scored in a 48-minute game. The Orlando Magic’s 69 points in their Play-In Round 1 loss to the Chicago Bulls were the fewest points scored in the tournament.
13 of the 29 games saw the lower-seeded road team upend the higher-seeded home squad. In some cases, the tournament seeding belies the fact that a lot these teams were playing with rosters bolstered by new acquisitions and full health.
Nevertheless, there were a number of surprising upsets in this tournament. The Warriors’ housings of the top-seed Bucks by 37 points and the Heat by 26 were pretty surprising. GSW winning wasn’t the surprise, the margin by which they won was. The Lakers’ 35-point win over the Nets in the Round of 16 also falls into that category.
The biggest shocker was the No. 10 Portland Trail Blazers’ overtime loss to the No. 23 Sacramento Kings. The Blazers were the home team, were led by Damian Lillard’s 57 points and 10 assists, and knocked down 12 3-pointers. They also forced 14 turnovers, nine more than they committed.
Somehow, that wasn’t enough. The Kings dropped 102 points in the paint, blocked eight shots, and out-rebounded Portland 65-38. De’Aaron Fox paced the victors with 37 points.
Lillard’s 57 were the second-most individual points scored in the tourney. The top spot goes to Luka Doncic’s 68 points in Dallas’ quarterfinal loss to Golden State. Stephen Curry countered in that game with 50 points for the victorious side, marking the third-most of the tourney and the most in a win.
Statistical Observations
Even though it’s always fun to set up two teams and watch the CPU go at it with itself, I did do this exercise for the sake of data collection. The numbers ultimately show that this game, by default, doesn’t quite represent modern top flight basketball.
Too Inside Basketball For the Realism Crowd
The most glaring issue is this game’s shot distribution. Teams in the tournament averaged 92.0 attempts per game, a number the real NBA hasn’t reached since the late 1970’s, hitting 92.9 in 1977-78 and 92.0 on the nose in 1976-77. Despite the high number of shots, the CPU averaged just 14.5 3-point attempts per game. Teams in 2021 attempted 2.39 times as many long-rangers, and haven’t taken that few since 2002-03.
In fact, it felt like the CPU was averse to any shot beyond the free throw line. Just 21.5 percent of tournament shot attempts were from mid-range (2-pointers from 15 feet and beyond) or 3-pointers. Per Basketball Reference, that number in 2020-21 was 56.0 percent.
The culprit for these issues is pretty clearly in the individual player tendencies. They are geared towards getting the CPU into the paint. Remember those 102 interior points I said the Kings scored in their upset over the Trail Blazers? The real Kings’ 2021 best was only 68 points. How was Sacto able to go so hard in the paint in my preseason sim tourney?
It’s a cocktail of high inside tendencies. At the time of simulation, players in the Official 2K Roster had an average Driving Layup tendency of 52, an average Close Shot Tendency of 39, and an average Attack Strong on Drive tendency of 33. Despite the average Step Through Shot tendency being 21, that tendency feels overpowered. It gives the CPU a chance to muscle their way into an interior shot even when their initial attempts are thwarted.
The biggest catalyst, however, is the Driving Dunk tendency. Almost every dunker in the official roster has a tendency number of at least 65. Minnesota rookie Leandro Bolmaro’s 40 is the lone exception. This, as well as the multiple finishing badges available to players and almost every player having a hot zone under the basket, led to tournament teams averaging 6.1 dunks per game. The real league average in 2021 was about 2.1 slams per contest.
By comparison, a lot of outside shooting tendencies were left gravely low by the developers. For instance, the average Mid-Range tendency is 12. Deceivingly, the average 3-point tendency is 53. However, a lot of the more situational tendencies that facilitate more treys in the actual gameplay are left low.
For instance, the average spot-up 3-point tendency is 39, compared to the average spot of drive tendency of 51. That means that most of the time in spot-up situations, the CPU is going to opt to go to the basket instead of taking the open shot. Same thing for Off-Screen shots, where the average 3-point tendency is 37 while the drive tendency in that situation is 52.
On top of that, the average Contested 3-point tendency is 6. The Average Stepback 3-pointer tendency is 31, but considering a player needs at least a 25 to trigger that shot, it’s basically a 6 as well. The average Driving Pull-Up 3 tendency is 13, while Shoot from Triple Threat is just 19. Additionally, the average Play Discipline is 59, with a lot of players set to 99. With most plays in the playbook and most of the tendencies aimed towards shots at the basket, it’s blatantly obvious why there is such a lack of outside shooting!
Flipping the Script on Shot Efficiency
Once the shots go up, the efficiency of them going in was a mixed bag. Teams in the tournament averaged 102.6 points per game, 9.5 points fewer than the 2021 mark of 112.1 and aligning more with the 102.7 points averaged in 2015-16. They collectively shot 47.7 percent from the field. That’s just 1.1 percent higher than the league’s 2021 percentage, but the NBA last hit that exact mark in 1988-89. They also made 82.4 percent of their free throws, though the league average record is 77.8 percent, which was set this past season.
Tournament teams didn’t shoot the 3-ball a lot, but they scorched the nets when they did! They hit 44.6 percent of their attempts. The real league record for average percentage is 36.7 percent, accomplished in 1996, 2009, and 2021.
Unsurprisingly, the Warriors’ accounted for quite a few of those 3-pointers. There were only 10 out of a possible 58 instances of tournament teams attempting 20 or more treys. Golden State accounted for five of those. They took 17 percent of the tourney’s total 3-point attempts, and knocked them down at a 57.3 percent clip!
By comparison, the real Dubs shot “just” 37.6 percent in real-life 2020-21. That was good for ninth in the league, but almost 20 percent less than their 2K counterparts. Golden State never even reached that percentage in a game in 2021, topping out at 53.5 percent in a January win over the Kings.
Stephen Curry is very much the ringleader of this very unreal display. He led the team in scoring in all five games, averaging 39.0 points per game. He has 20 shooting badges, four of which are Hall-of-Fame level and 15 more that are Gold. Steph wasn’t going to miss much with those badges at his disposal.
However, even when you factor out the Warriors’ wild tournament from distance, the rest of the field still shot 42.0 percent from beyond the arc. I can’t tell if that’s because having the 3-point success slider at 60 is too high, or if it’s because the CPU made sure that the few triples they went for were very good shots. I will definitely need to test more to get to the bottom of that.
The temperature was much colder inside the arc. The tournament average for shots within the restricted area of 66.9 percent is fairly in-line with the real 2021 average of 67.5 percent. However, the field shot just 30.2 percent on shots from outside the restricted area to 15 feet, while the league average is 43.0 percent. They also hit 31.6 percent of their mid-range shots, though the 2021 mean was 40.9 percent.
All told, the tournament came away with a 51.2 effective field goal percentage. That’s 2.6 percent lower than the 2021 league average, but similar to the 51.4 percent return in 2016-17. The tournament’s 53.2 true shooting percentage is four points below the 2021 NBA average. A high efficiency on 3-pointers despite the low attempt rate was balanced out by low efficiency and high volume on shots closer to the basket. Basically, the shot zone math was all over the place, but the final equation that is the overall field goal percentage somehow came out fairly normal.
Other Observations
There was also a strong lack of fouls. This sim tournament averaged 7.3 fouls and 10.2 free throw attempts per game. The real NBA has never averaged fewer than 19.3 fouls (2021) or 21.7 free throw attempts (2018) per game. However, I somewhat understand this, as fewer fouls leads to longer bouts of flowing gameplay for the user.
However, when I’ve attempted to increase foul sliders or an individual’s draw foul rating in other sims, it feels like the CPU then goes out of their way to foul even less than they already struggled to do. Part of me figures that player finishing badges might have something to do with that, as the animations they cause provide cool, flashy moves over seeking to draw fouls.
Altering the steals and block sliders also proved to be a wise decision. The tournament averaged 8.4 steals and 4.1 blocks, compared to reality’s 7.6 steals and 4.9 blocks. The NBA hasn’t had as many steals as this tournament had since 1999 and has never averaged so few blocks. The current nadir is 4.3 per game in 1975, the second year blocks were tracked. However, I’d much prefer to have that few blocks compared to the eight or nine per game that happens by default.
Overall pace and turnovers were also on the lower side. The tournament’s 94.3 possessions per 48 minutes is more in line with the 93.9 pace of 2013-14 and 2014-15 NBA. The 10.2 turnovers per game beat out the real all-time low of 13.8 per game that was set in 2020-21.
Due to the shooting struggles inside the arc, there was an uptick in rebounds per game compared to reality. The 50.0 rebounds tournament teams average hasn’t been seen in the real NBA since the 50.6 grabbed in 1972-73. The 10.7 offensive boards is fairly in line with modern averages. It’s closer to the 10.9 averaged in 2014-15, but is 0.9 off from the 9.8 averaged in 2020-21. The 39.3 defensive boards per game in the tournament would a record for a season, with the current best being 34.8 in 2018-19 and 2019-20.
But to end on a positive note, the assist average was nearly on target. The tournament’s 25.7 assists per game are a number the real league last reached in 1989, but was still just 0.9 more than the 2021 average.
Conclusion
Despite the statistical discrepancies, NBA 2K22 is a very good game and fun to spectate for CPU vs. CPU matches. I also agree with the sentiment that this is a much improved experience from 2K21. I’m glad that a lot of people are enjoying it. However, by default, this game drastically fails to present a simulation experience similar to what we are getting from the NBA in 2021. It’s definitely an intentional decision, and likely a wise one when it comes to making the game fun to play for average user. Unfortunately, for simulators like myself, it’s an aggravating reality.
Luckily, there are plenty of tools provided to me to alter this game to my liking. With the results of this sim tournament serving as a foundation, I can get back to work trying to bring this game closer to what we see on our TVs everyday.
This was a lot of fun to do and I’m looking forward to more simulation projects on the horizon. Thank you so much for reading this, and congratulations to the Los Angeles Lakers on winning the 2021 Preseason Simulation Tournament!
More Stories
Blue State & Red State All-Stars Face Off in NBA 2K Simulation
Embiid, Harris, Simmons Combine for 70 as Sixers Wallop Wizards
Graham’s 40 leads Hornets past Celtics